TRIANGULAR_TO_CARTESIAN
Formulas
Produces the X coordinate:
=TRIANGULAR_TO_CARTESIAN_X(leftAxisPercentage, rightAxisPercentage, bottomAxisPercentage)
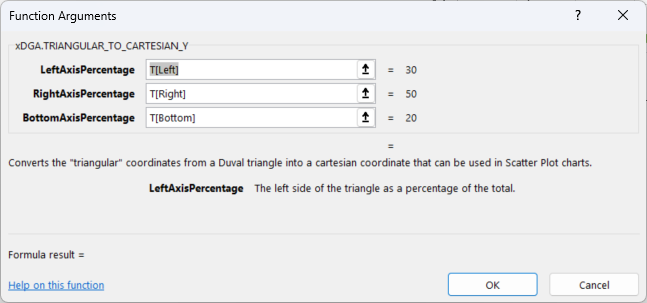
Produces the Y coordinate:
=TRIANGULAR_TO_CARTESIAN_Y(leftAxisPercentage, rightAxisPercentage, bottomAxisPercentage)
Description
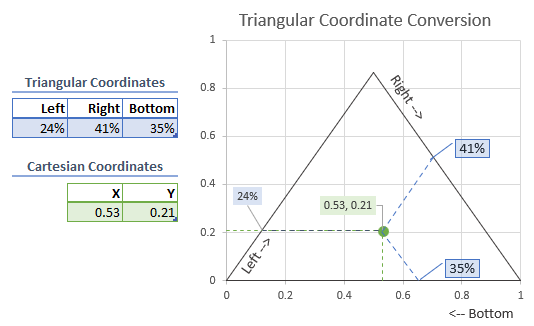
The Duval triangle data points are plotted based on the amount of each of the three gases represented by the triangle.
In this calculation, the amount of gas is converted to a percentage relative to the total of the three gases.
For simplicity, we will call the three sides of the triangle Left, Right and Bottom. In the Duval's triangles, each of these triangular axes represent one of the gases par of the analysis.
These two formulas take the three percentages from the gases and output the X and Y cartesian coordinates.
These values can be used to directly plot the data point on a regular Excel Scatter Chart.
These can be used in combination with xDGA's Duval charts to create great looking reports.
Output