PENTAGONAL_TO_CARTESIAN
Formulas
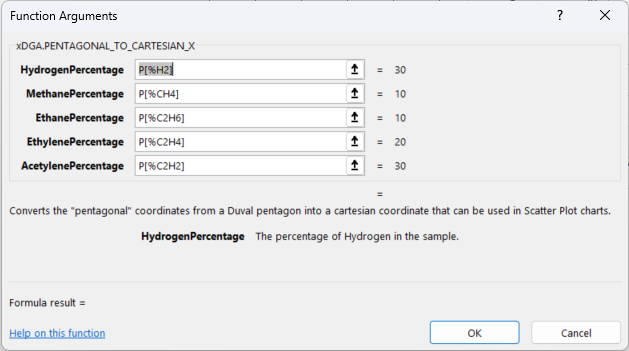
Produces the X coordinate:
=PENTAGONAL_TO_CARTESIAN_X(hydrogenPercentage, methanePercentage, ethanePercentage, ethylenePercentage, acetylenePercentage)
Produces the Y coordinate:
=PENTAGONAL_TO_CARTESIAN_Y(hydrogenPercentage, methanePercentage, ethanePercentage, ethylenePercentage, acetylenePercentage)
Description
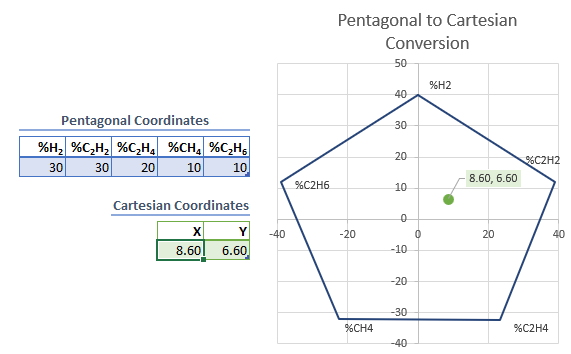
The Duval pentagon data points are plotted based on the amount of each of the five gases represented by the pentagon.
In this calculation, the amount of gas is converted to a percentage relative to the total of the five gases.
Please note that the formula indicates which gas has to go on what position. This is important to obtain the correct conversion.
These two formulas take the five percentages from the gases and output the X and Y cartesian coordinates.
These values can be used to directly plot the data point on a regular Excel Scatter Chart.
These can be used in combination with xDGA's Duval charts to create great looking reports.
Output