
The challenge of managing Power Transformers
A critical aspect of managing assets is to understand their condition, their performance against the organisation's objectives and the level of risk they represent.
Power transformers and other insulating liquid-filled assets are critical component of electrical grids. These are typically very expensive assets with long replacement lead times.
Utilities and other asset intensive organisations depend on assessments performed by Subject Matter Experts (SME) to make the most effective and efficient decisions. These SMEs are also busy dealing with all sort of emergencies and requirements from the day-to-day operation of the business.
Based on many years of accumulated experience, international reliability surveys and the hard work of many of these SMEs around the world, the industry has developed a range of diagnosis techniques that assist in the management of these assets.
One of the most common techniques to assess the condition of Power Transformers is through regular insulating liquid sampling and analysis. The Dissolved Gas Analysis component of this suite of tests is one of the most useful techniques to understand the transformer's condition.
This knowledge has been captured in the form of technical papers, guidelines and various study reports. These documents are rich with information and knowledge about the best way to assess the condition of each asset.
This documents have to be translated into an actionable algorithm or calculation in order to be useful. Without a standard implementation, most teams develop their own tools and calculation spreadsheets.
The use of digital tools to assist condition assessment
Digital tools can provide these SMEs the information they need to make opportune decisions and provide sensible recommendations.
When these decisions are recorded on digital platforms, the rest of the organisation benefits from having a consistent approach to making these decisions. Whether they are being made by a veteran in the industry or a young engineer or technician at the early stage of their careers.
A well-designed digital tool has the potential of supercharging the skills and experience of asset managers.
If you’ve ever tried to apply any of the available analysis guidelines, you’ll know that some of them are dozens of pages worth of information. Wouldn’t it be nice if all those rules were condensed in easy-to-use formulas that can be applied to your existing DGA data?
If only there was a tool that summarises all this knowledge and helps SMEs apply these algorithms easily and consistently.
xDGA was created with this purpose in mind.
What is xDGA?
xDGA is an Excel add-in tool that implements a set of custom formulas. These formulas enable is users to run industry best-practice algorithms to evaluate and assess the results of Dissolved Gas Analysis in Liquid Filled Electrical Apparatuses such as Power Transformers, On-Load Tap Changers, Circuit Breakers, etc.
The custom formulas are packaged as an Excel add-in which doesn’t require any additional software installed on your computer. Simply install xDGA from one of the available sources and you'll be up and running in no time. Read our installation guide
The main components of xDGA are as follows.
Custom formulas
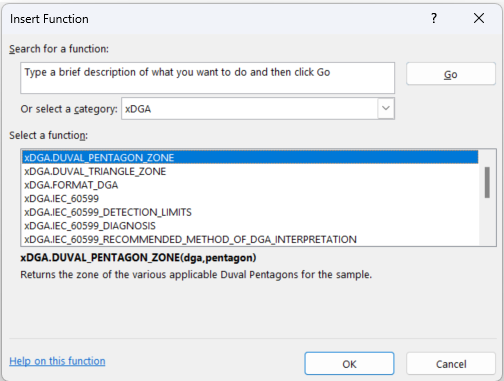
These custom formulas allow you to:
- Normalise the information required for further analysis using a DGA formatting function.
- Perform automatic conversions of the "triangular" and "pentagonal" coordinates of the Duval chart into cartesian X,Y coordinates. This is useful if you want to create Duval charts in your workbook.
- Run individual rules and diagnosis techniques such as Rogers Ratios, Duval Triangles, Duval Pentagons and sections of the IEC 60599 interpretation guidelines.
- Run a full assessment as per the IEC 60599 guidelines and get a "NORMAL", "ALERT" or "ALARM" assessment.
Read more about this feature in the Formulas section of the documentation.
Duval triangles and pentagons charts
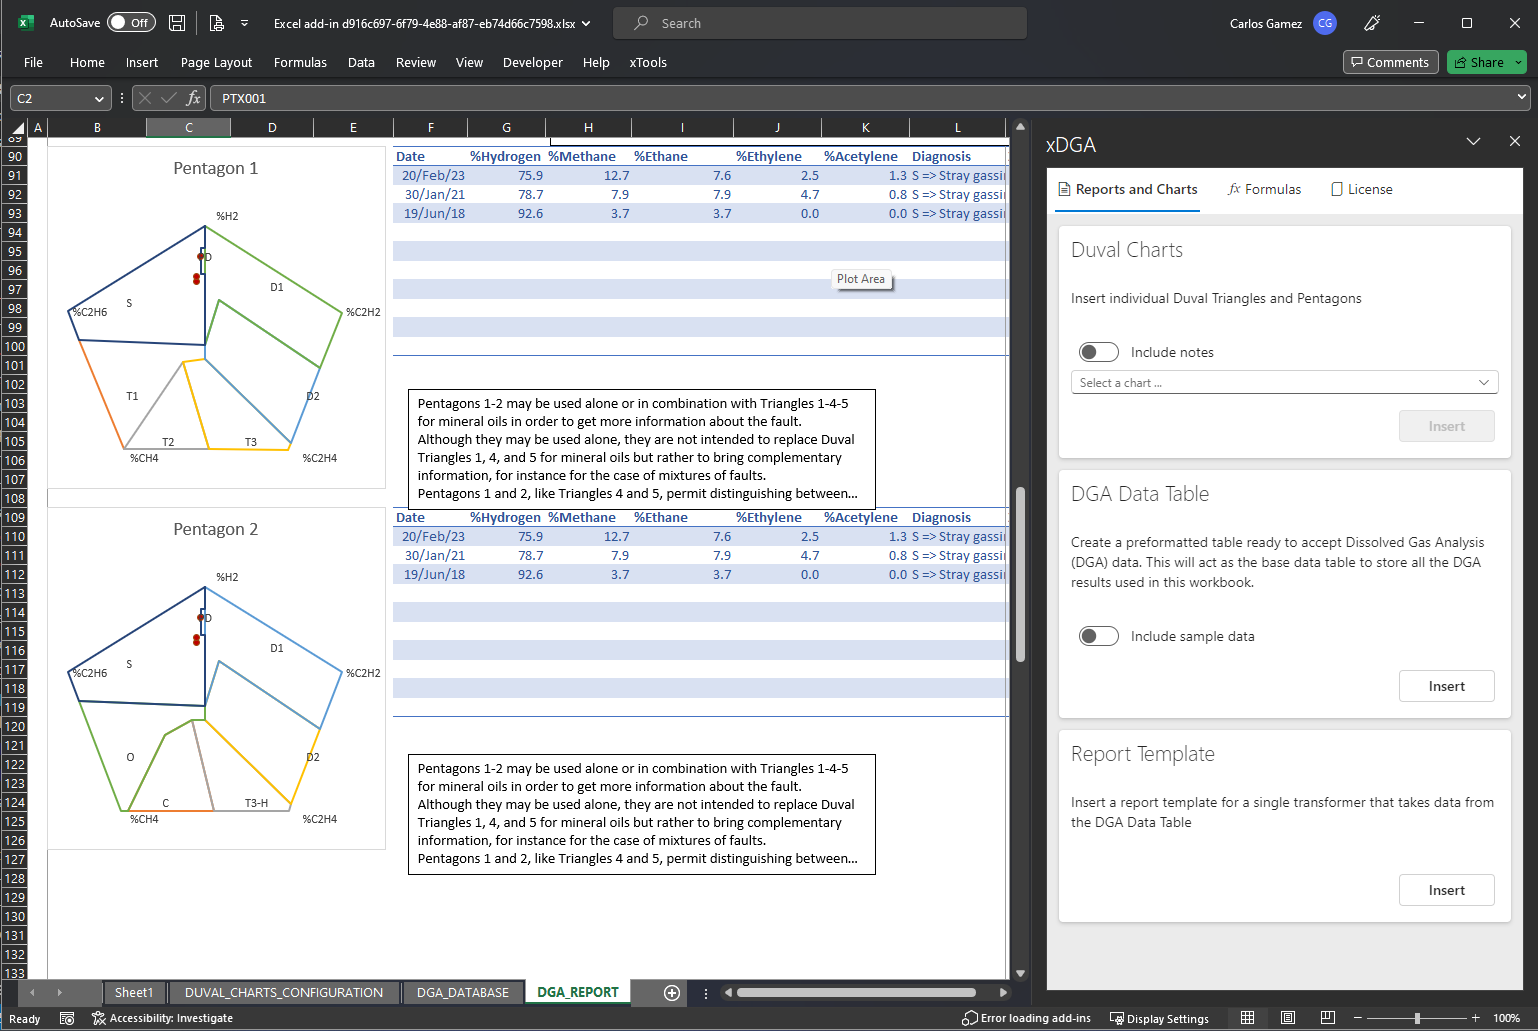
xDGA also has the functionality of inserting any of the Duval Triangles and Pentagons as Excel charts.
Each chart has been carefully crafted and formatted to be easily extensible by the user. Each zone is clearly labelled and all source coordinates to draw these areas are stored in a separate worksheet.
These charts can be inserted in seconds and will enhance any existing or new condition report.
Read more about this feature in the Charts section of the documentation.
DGA database and report templates
Building on all these features, xDGA provides you with two starter templates.
One inserts a new worksheet that contains an Excel table DGA database that is preformatted to act as a database for all your reporting needs.
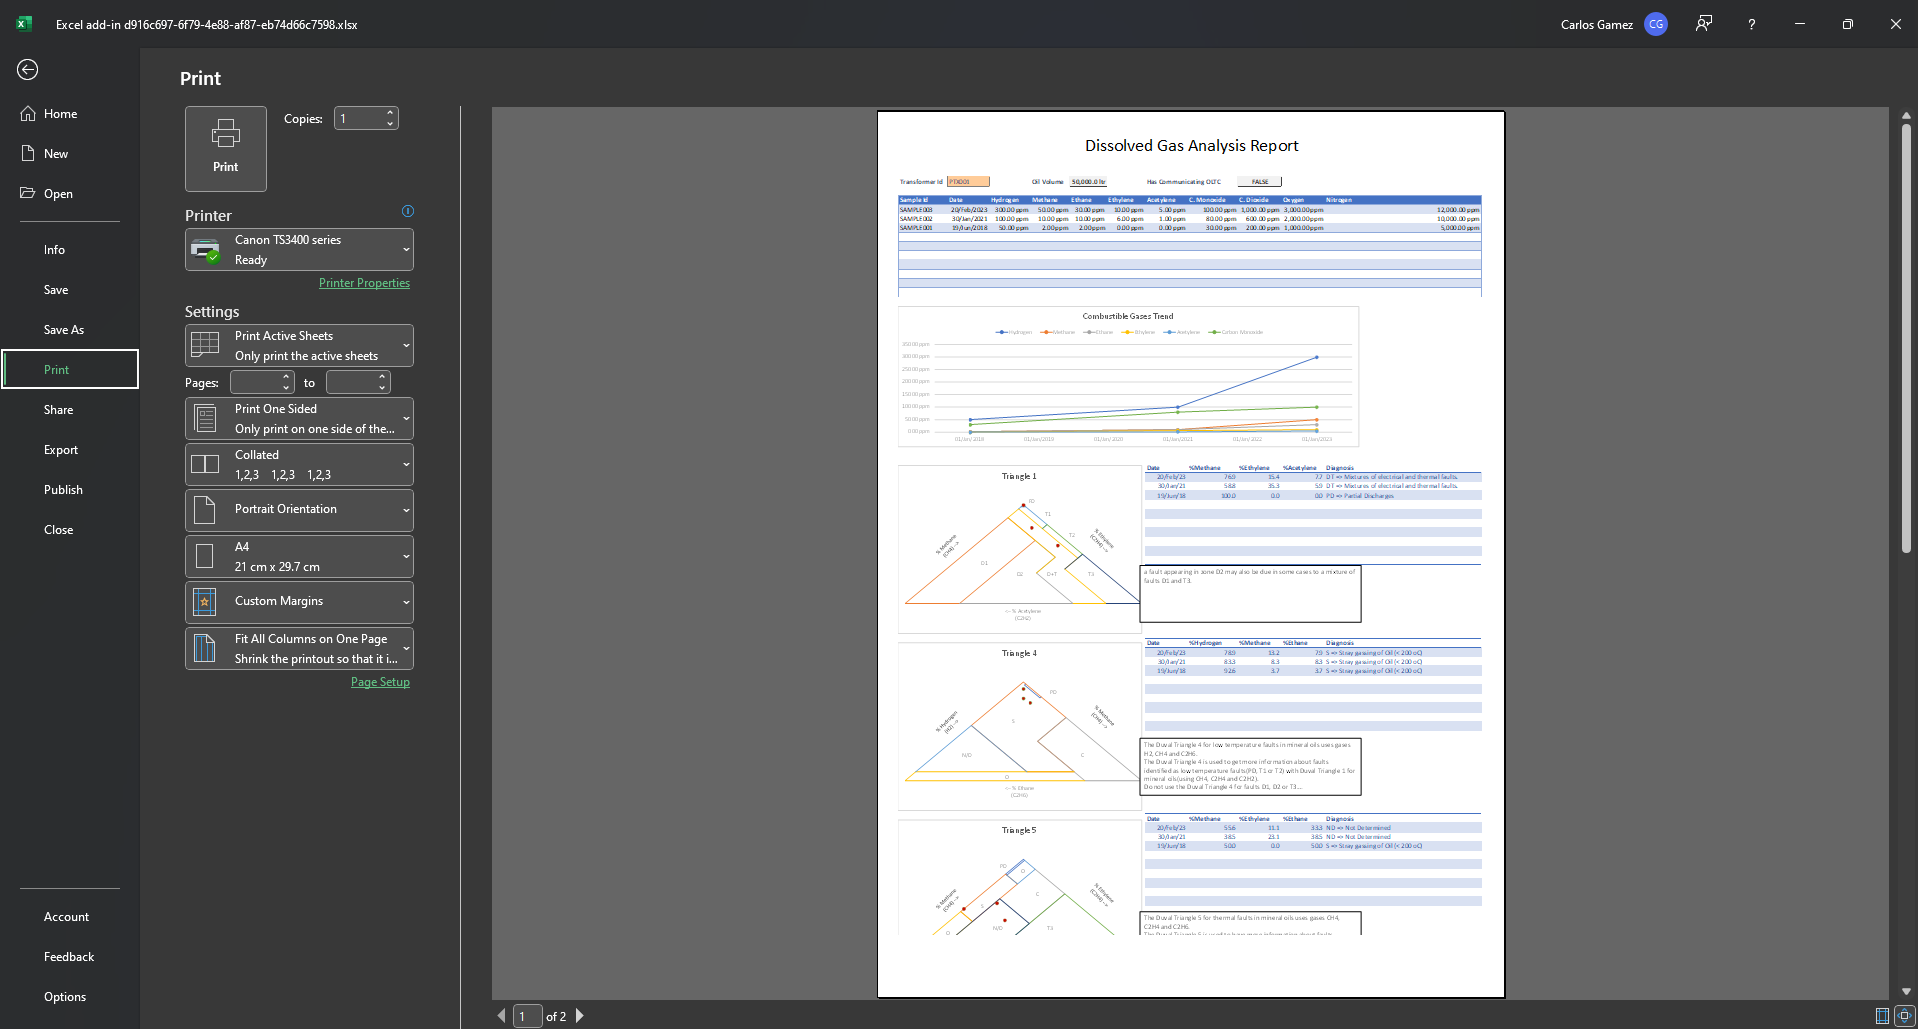
The second is a template for a full analysis report for an individual transformer. This report relies on the DGA database and it contains all the necessary formulas and formatting to just select a transformer from the drop-down list.
Read more about this feature in the Reports section of the documentation.
Interested?
What are you waiting for? The add-in can be downloaded from any of the Microsoft sources (see Installation) and you'll be up and running in a couple of minutes.
With one free month to try out all of its features, there is no risk to you or your team. If you don't like it, you don't buy it.
We hope you enjoy it and we welcome any feedback you might have.
Reference
If you would like to know more about the algorithms that the first version of xDGA implements, head to the Changelog section to have a look. We will also keep this section updated with any new releases and versions of xDGA.